
Pair the stress-band data
Keep each applied count n with the N corresponding to that same stress range and fatigue detail.
Bridge cranes for workshops and production lines.
Explore Overhead Cranes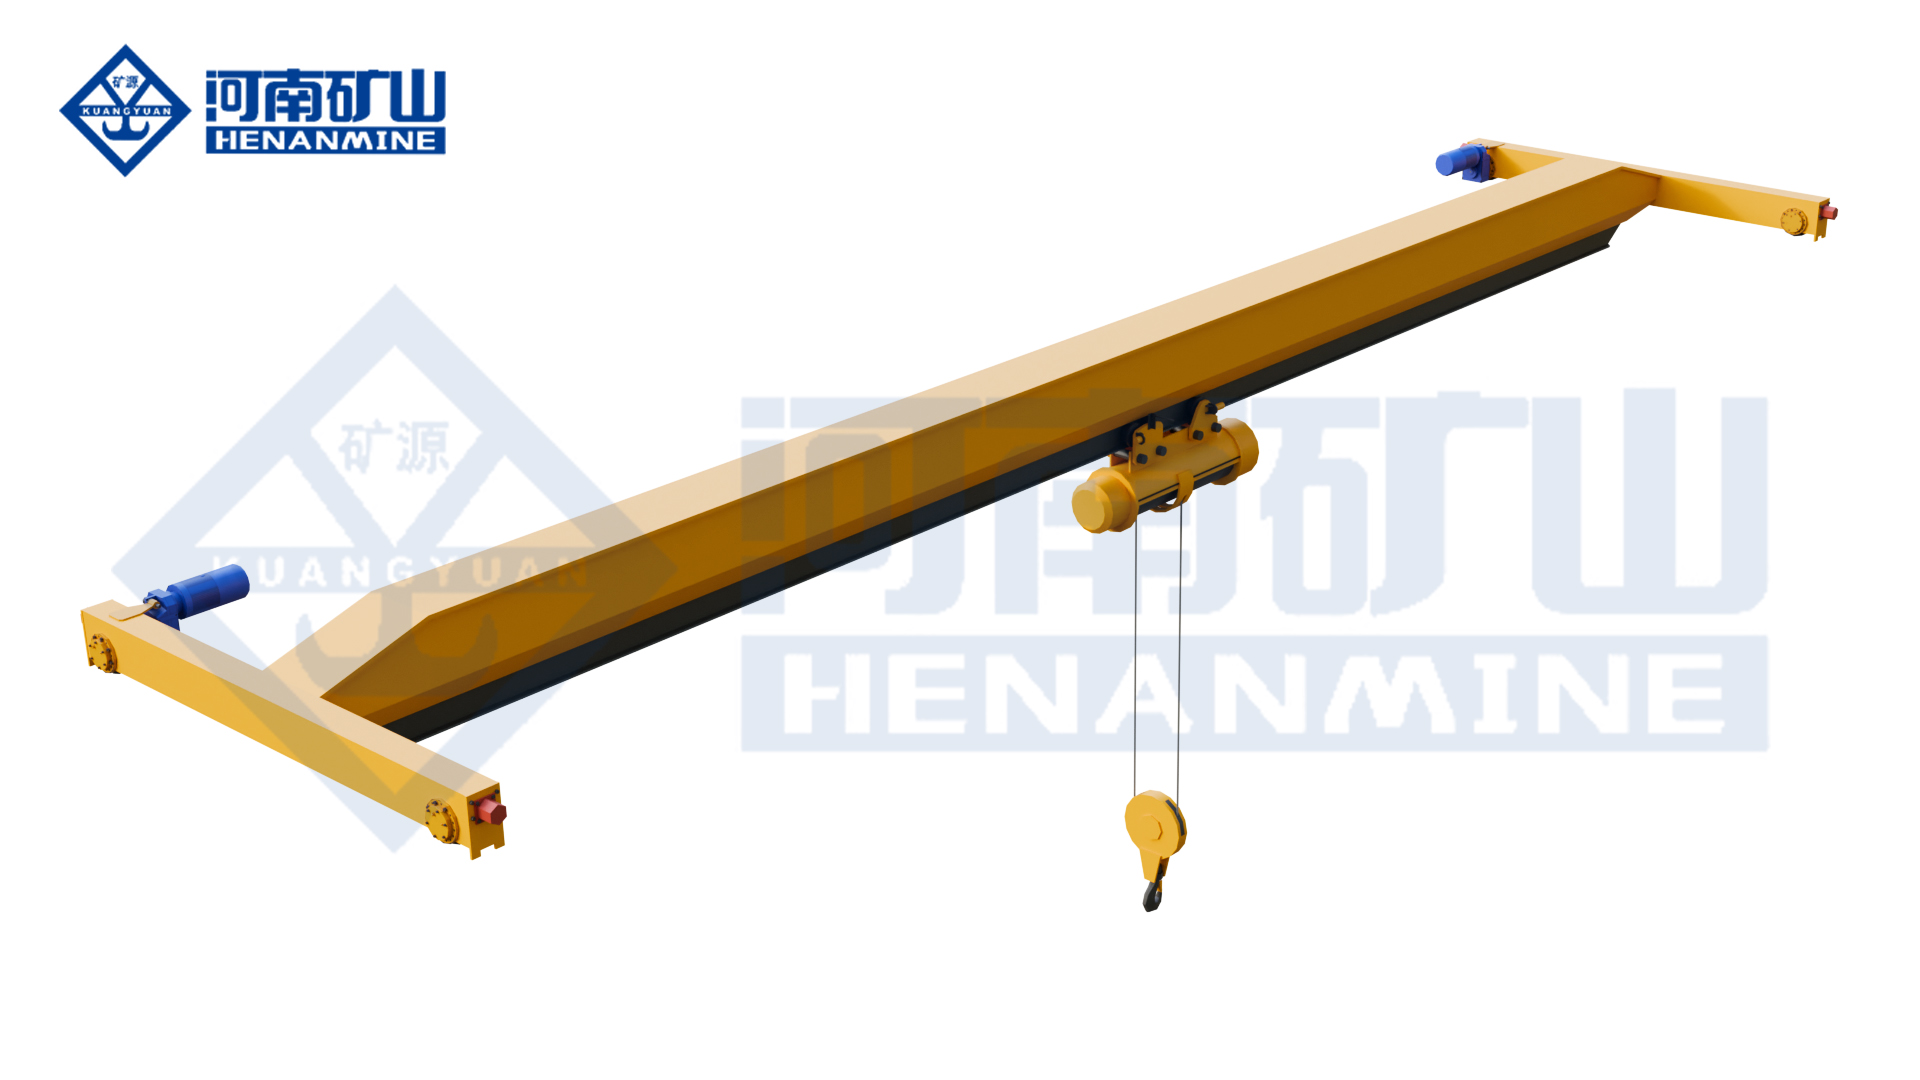
Ground-supported lifting for yards and construction.
Explore Gantry Cranes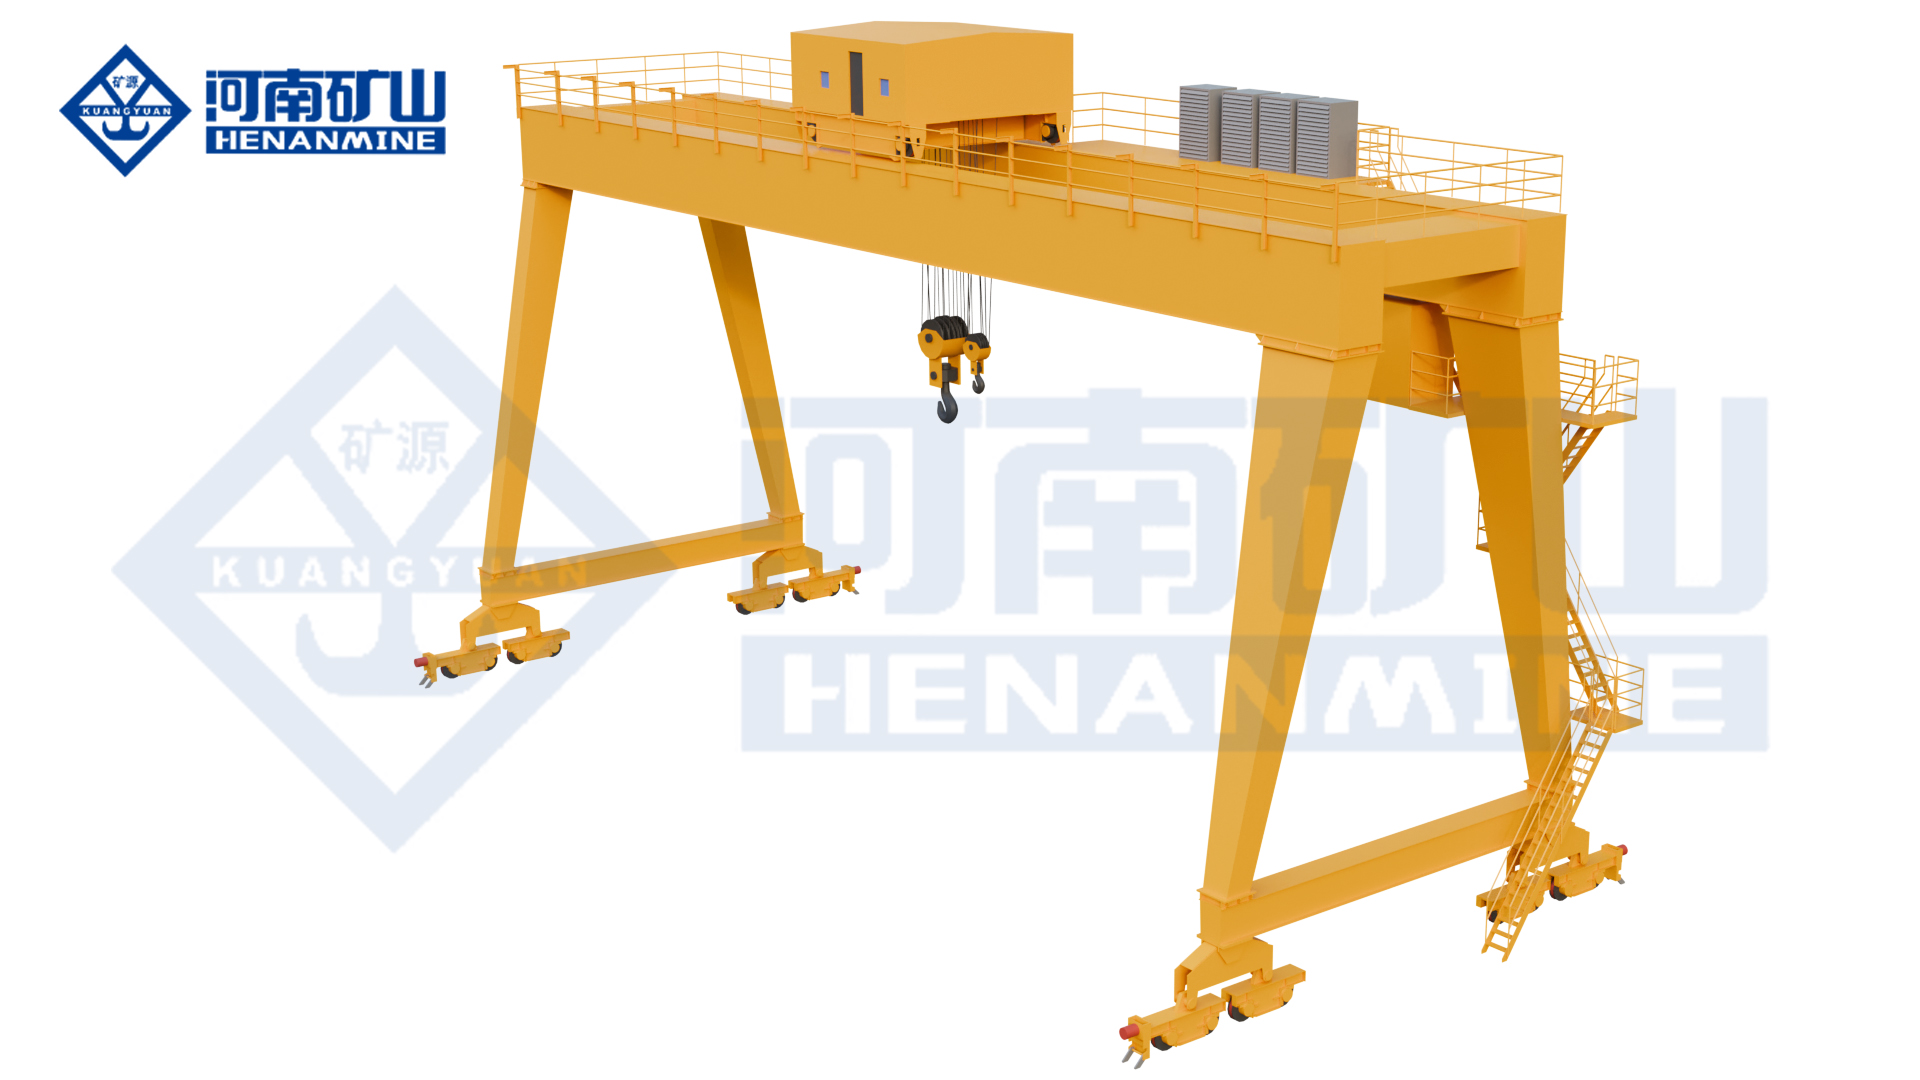
Wire rope and chain hoists for lifting points and cranes.
Explore Electric Hoists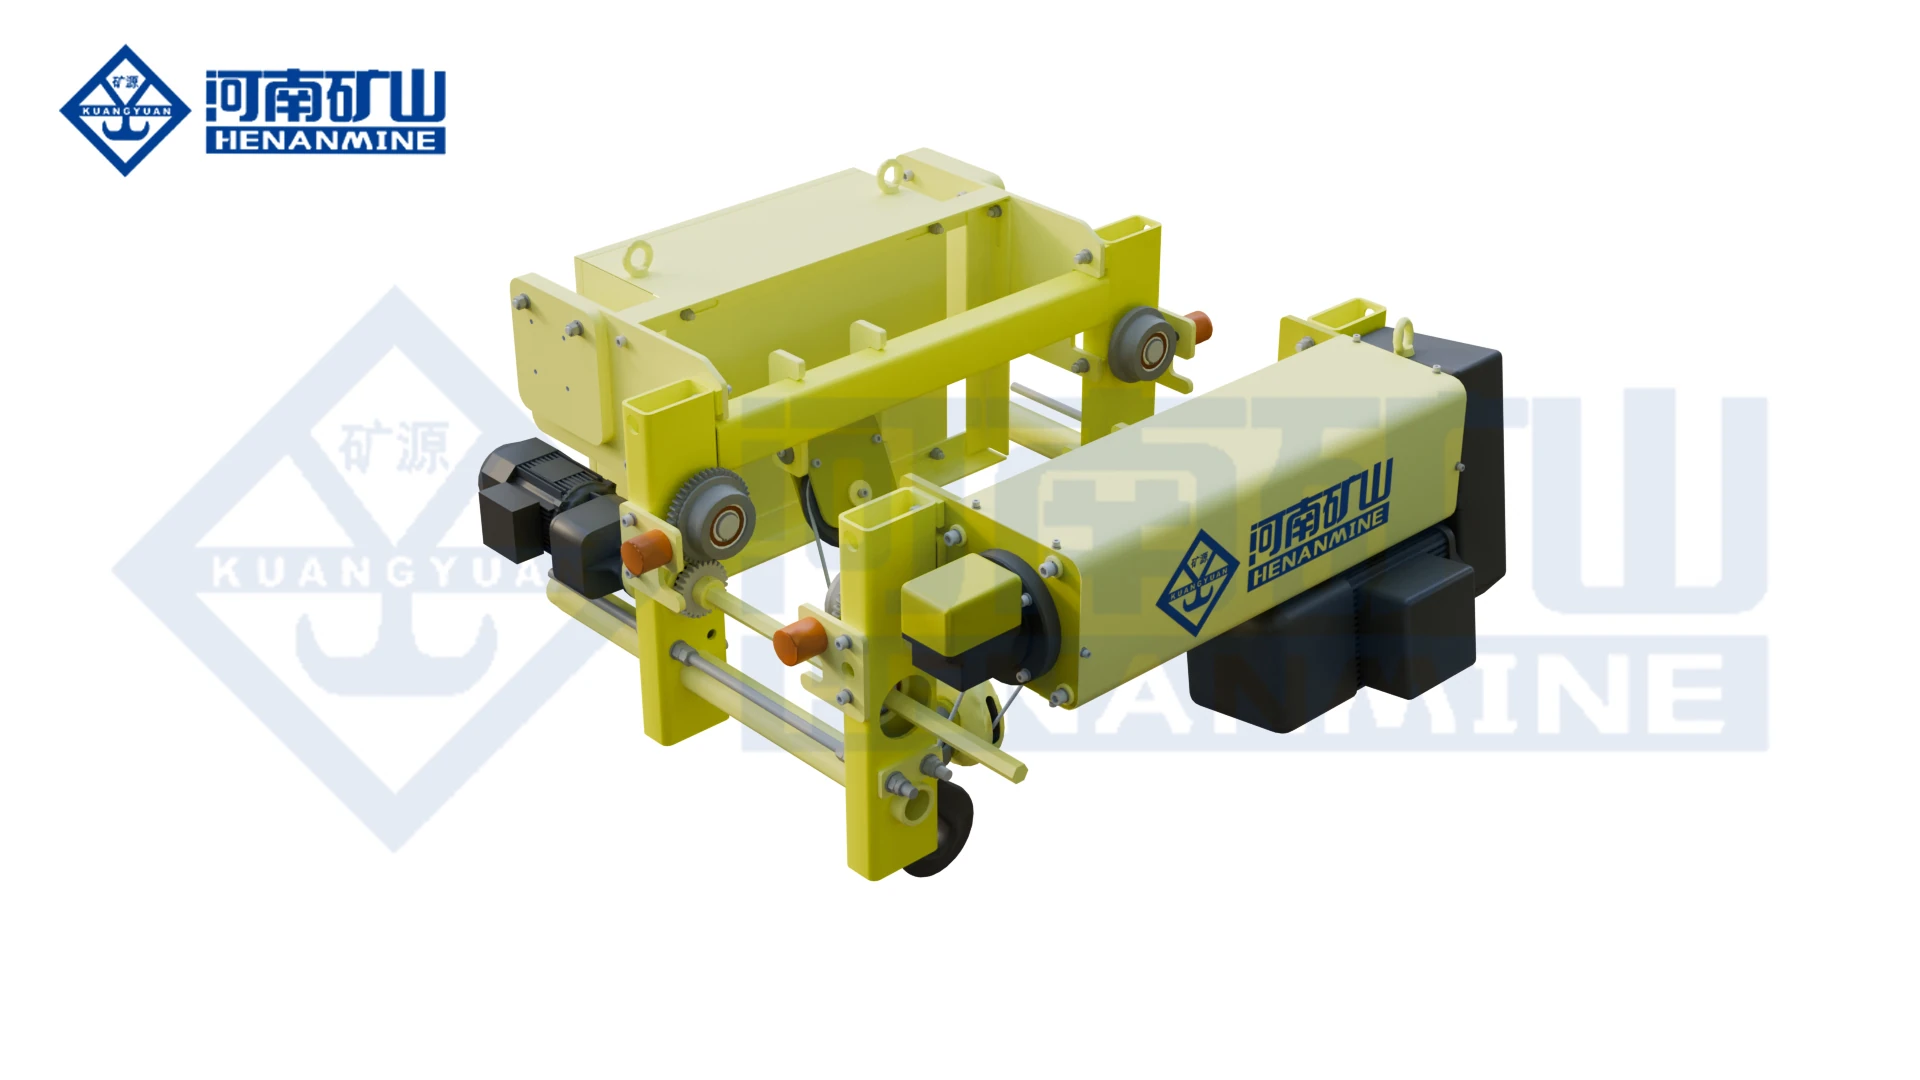
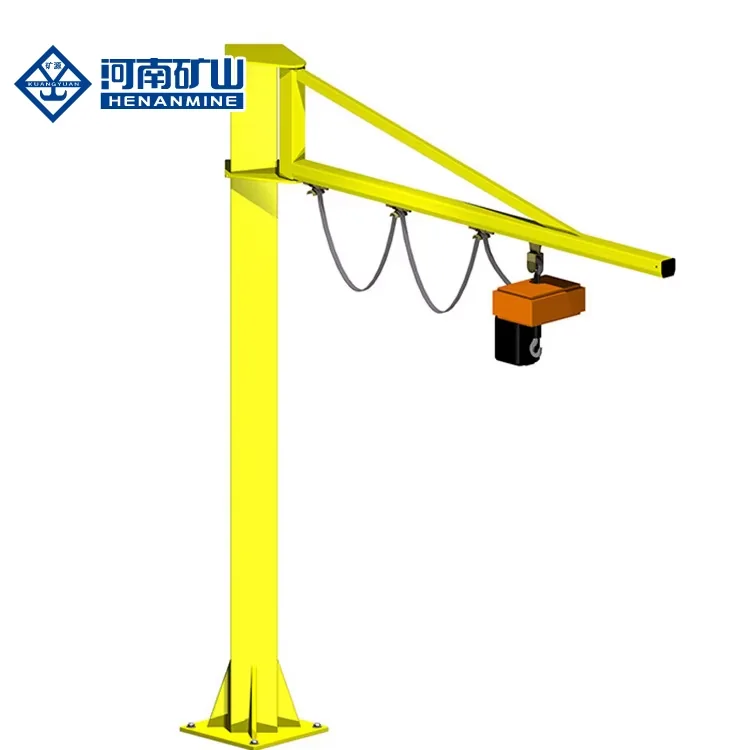
Wire rope lifting and pulling with a powered drum.
Explore Electric Winches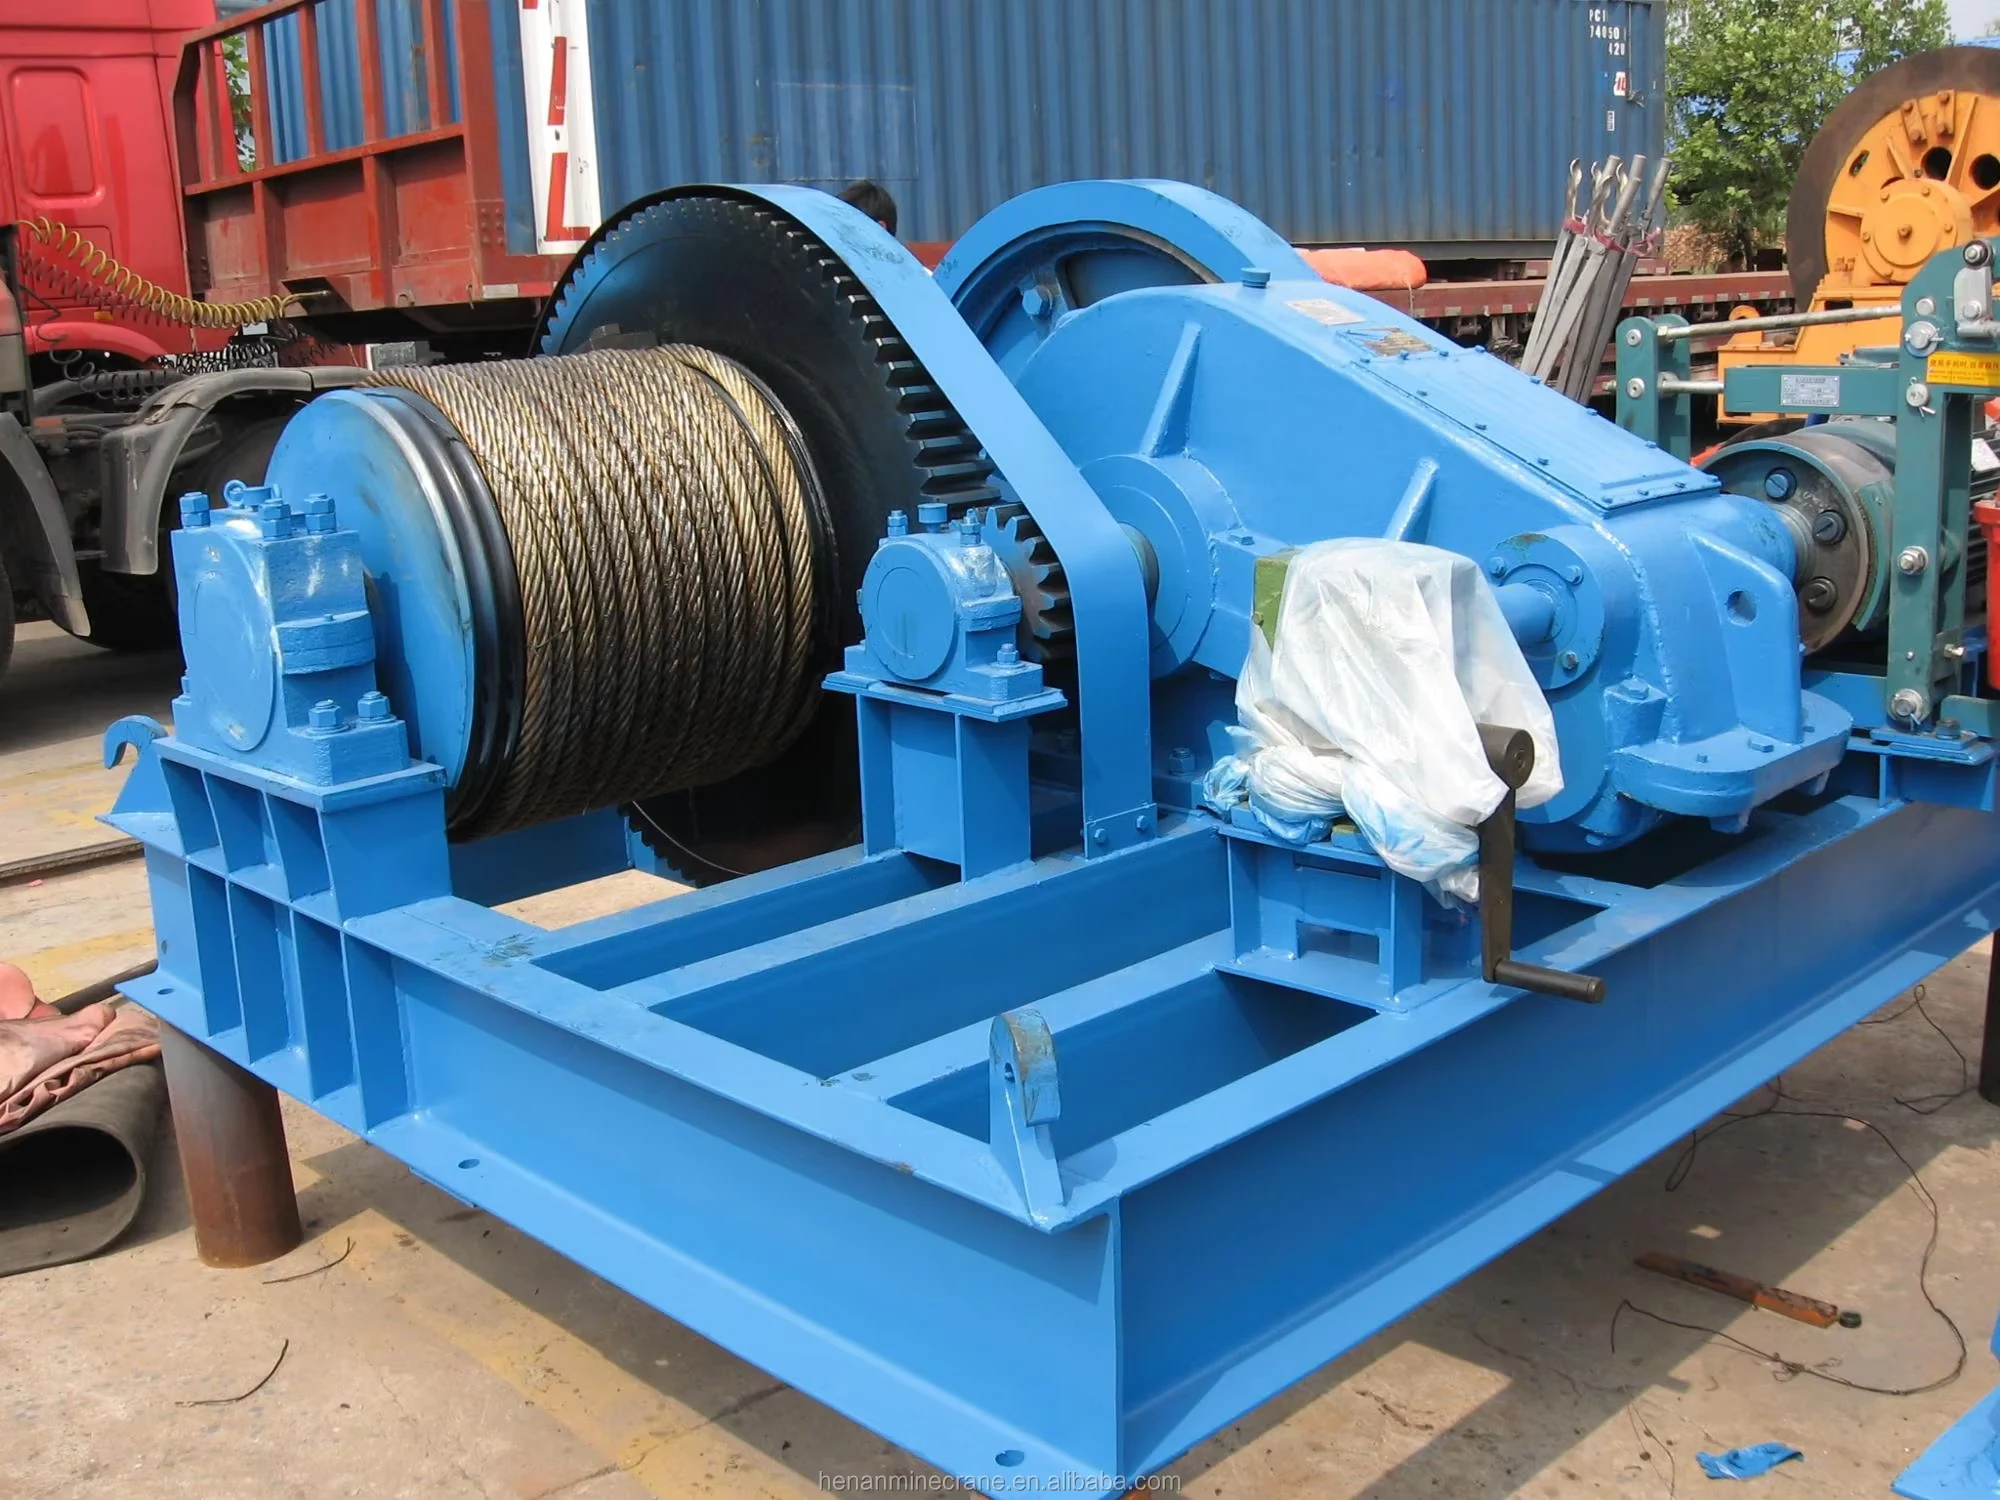
Grab buckets, magnets and hooks for your load.
Explore Lifting Attachments & Grabs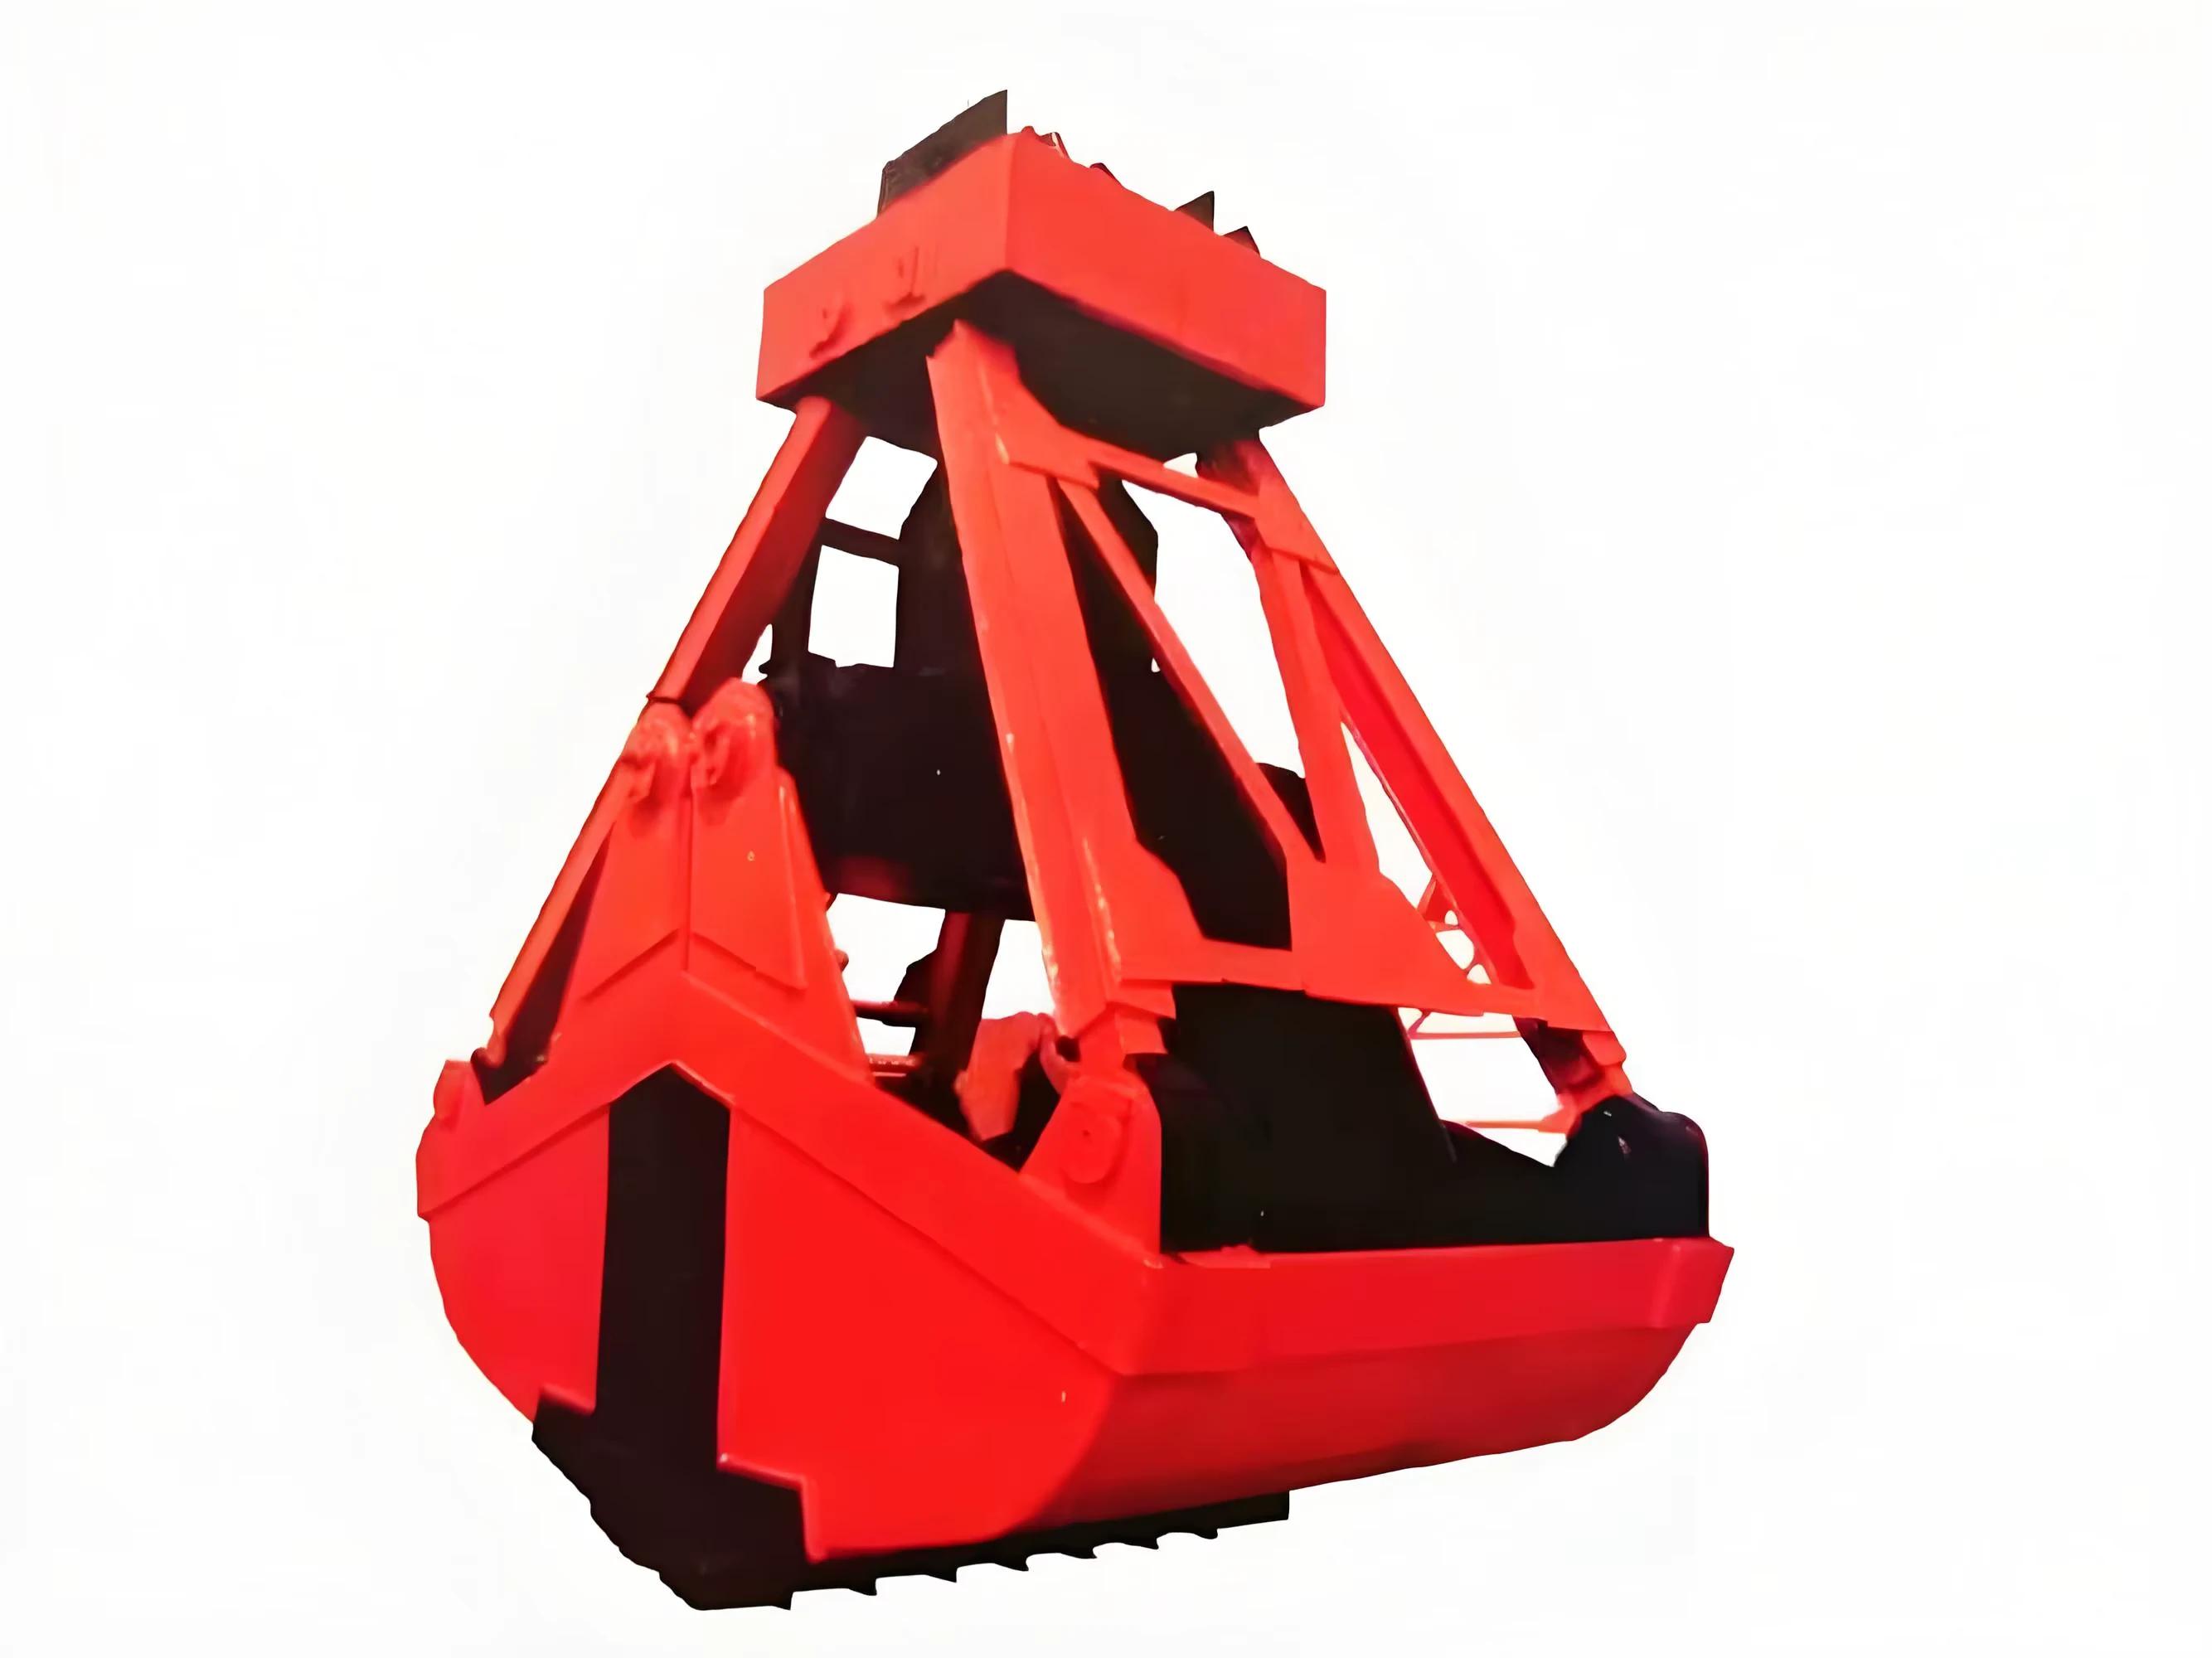
Mobile handling for containers, precast and yard loads.
Explore Rubber-Tired Gantry Cranes & Straddle Carriers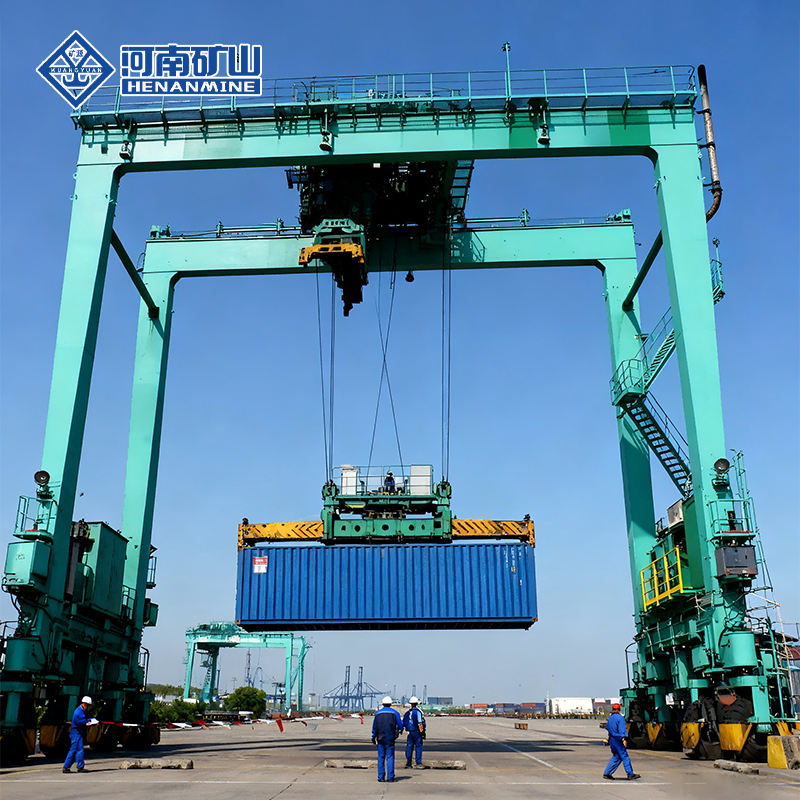
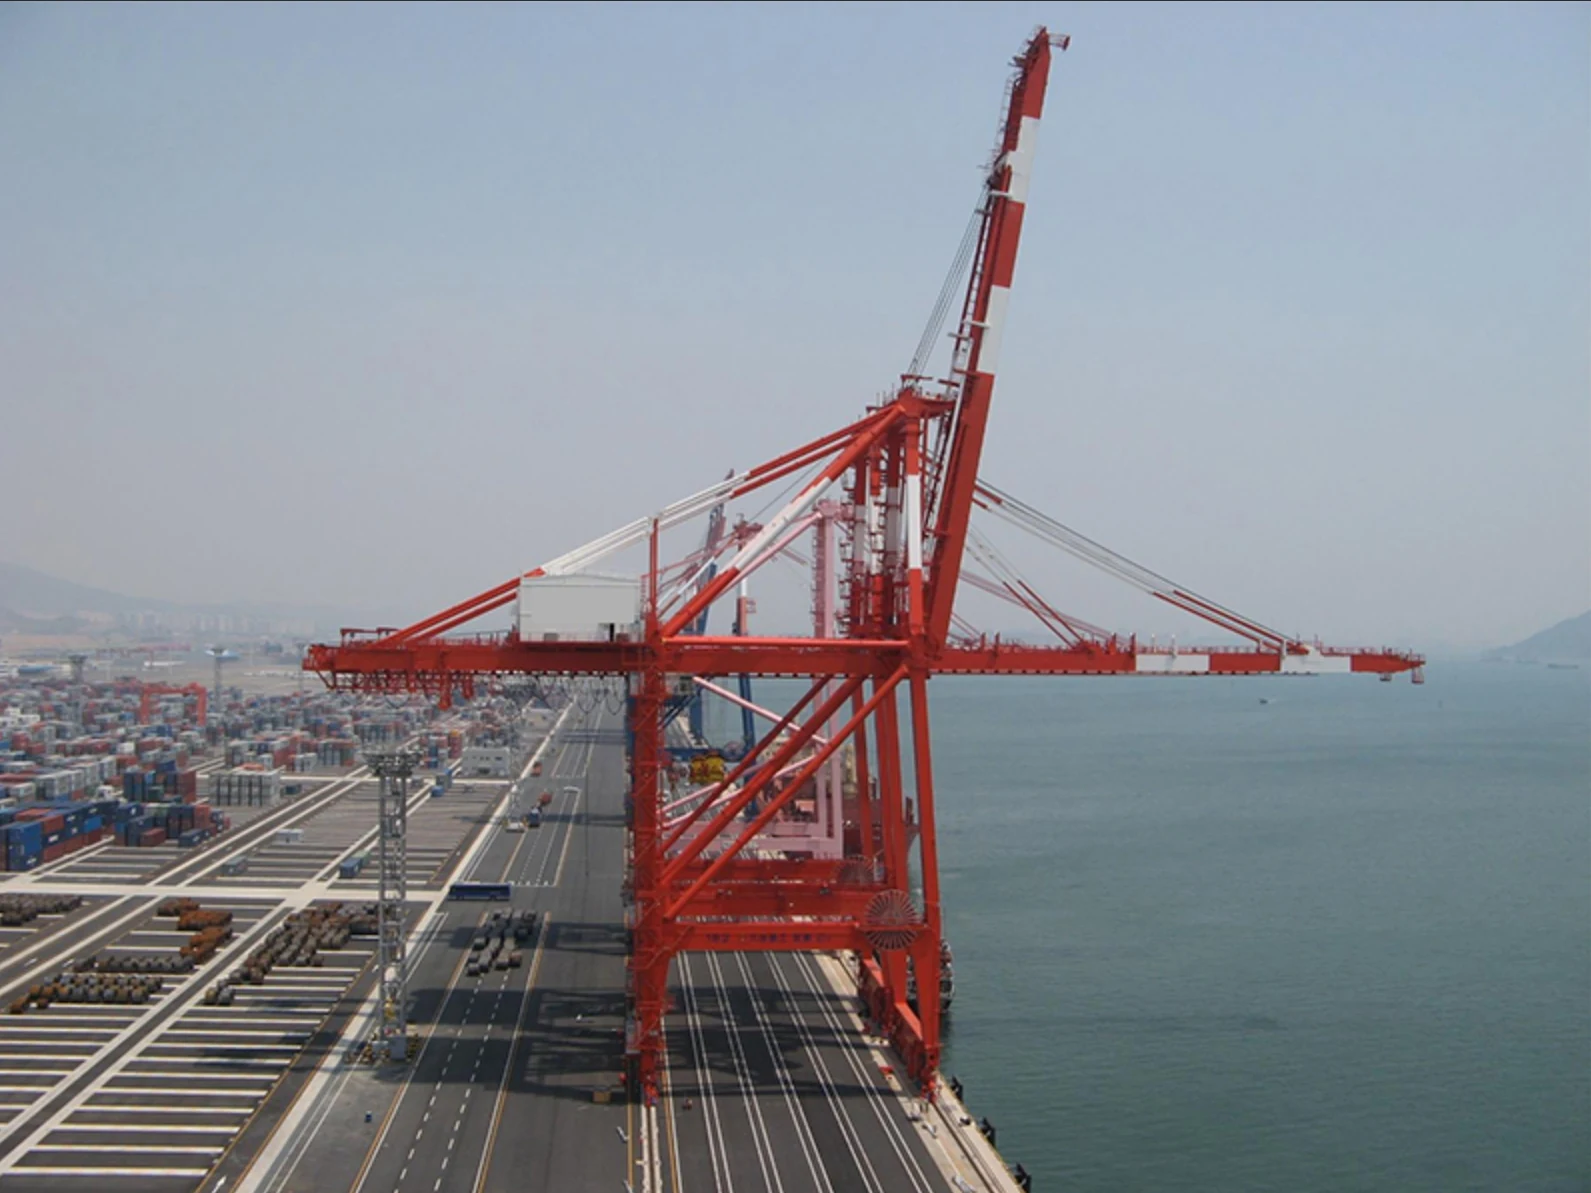
Lift and move vessels through boatyards and marinas.
Explore Marine Travel Lifts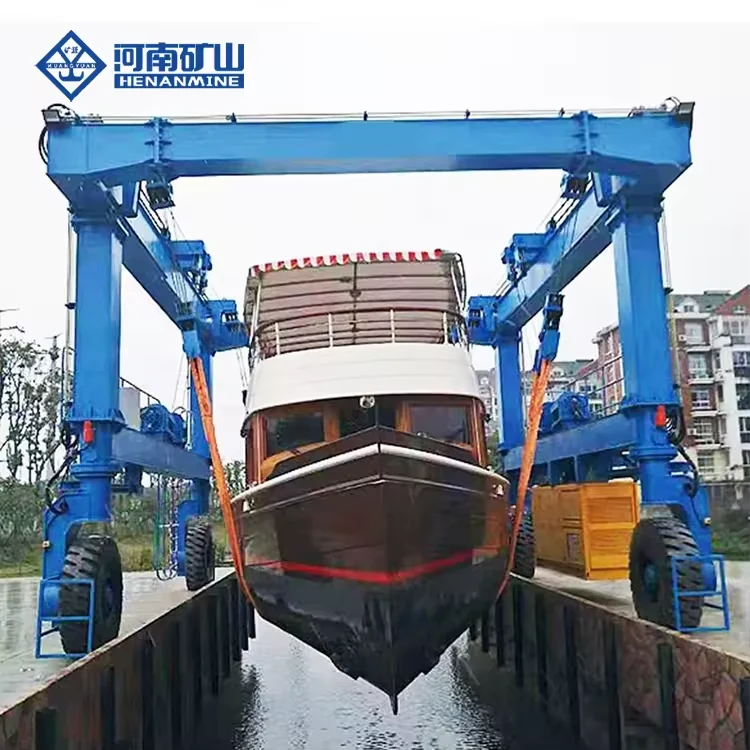
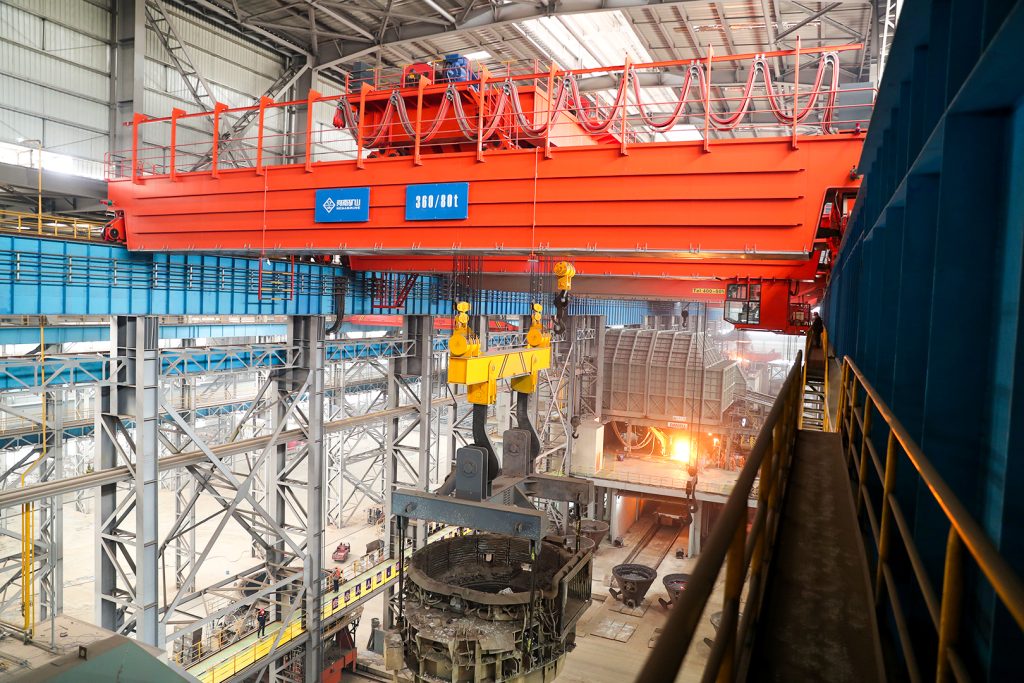
Ladle, slab, scrap and coil handling across steel production.
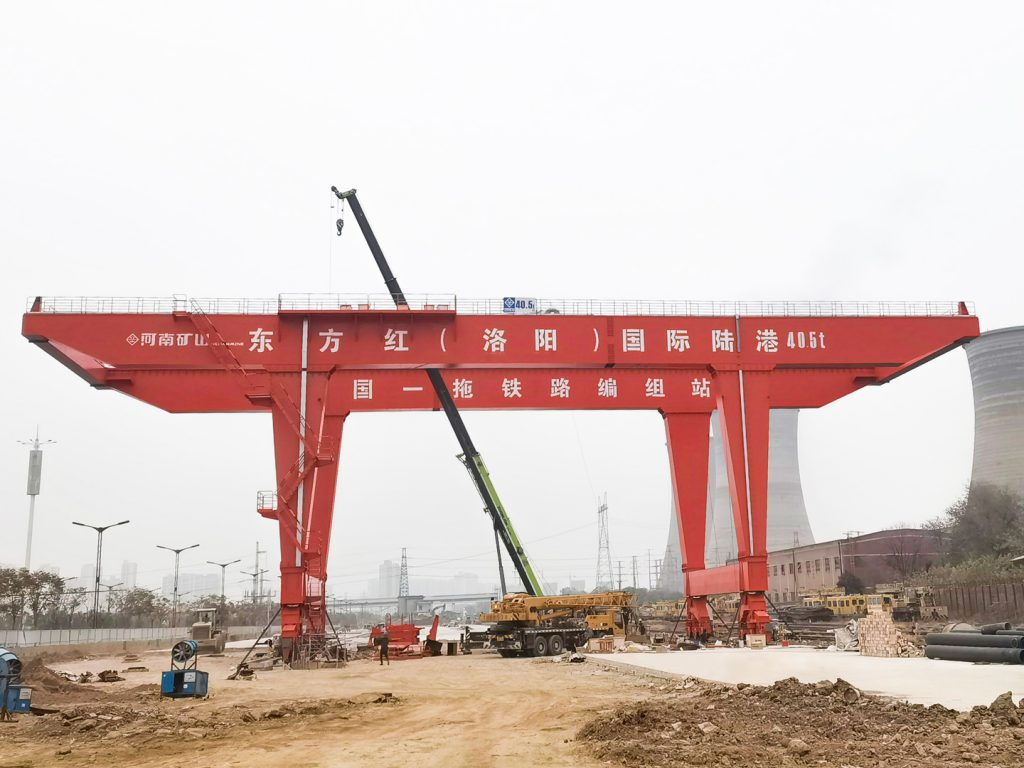
Container stacking and cargo transfers across terminals and rail.
Turbine installation, powerhouse maintenance and wind equipment assembly.
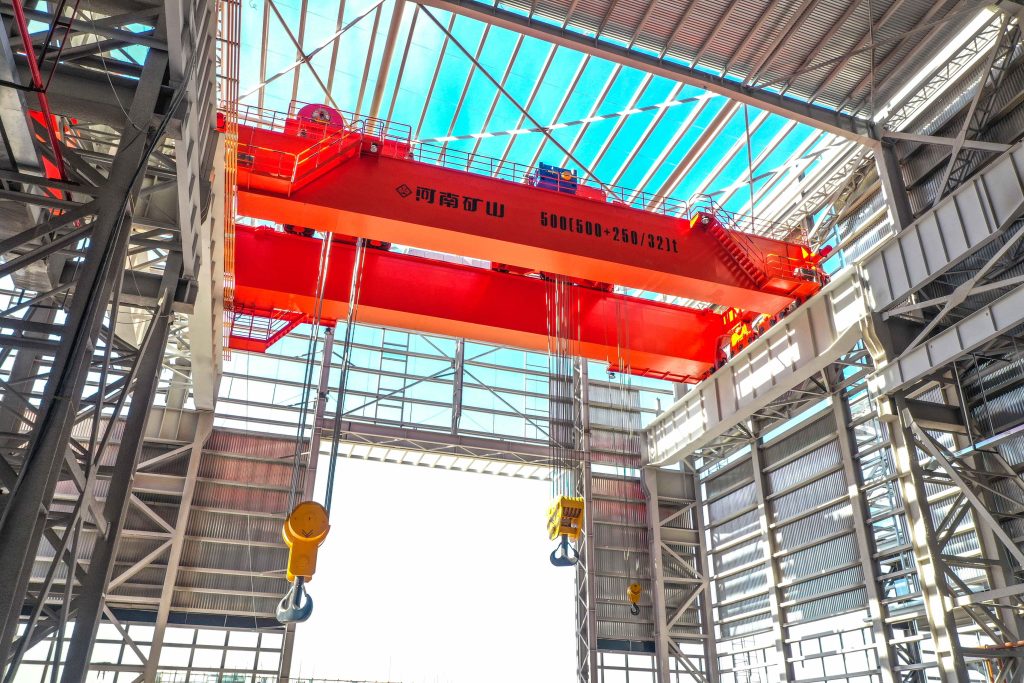
Controlled component transfer and positioning for precision assembly.
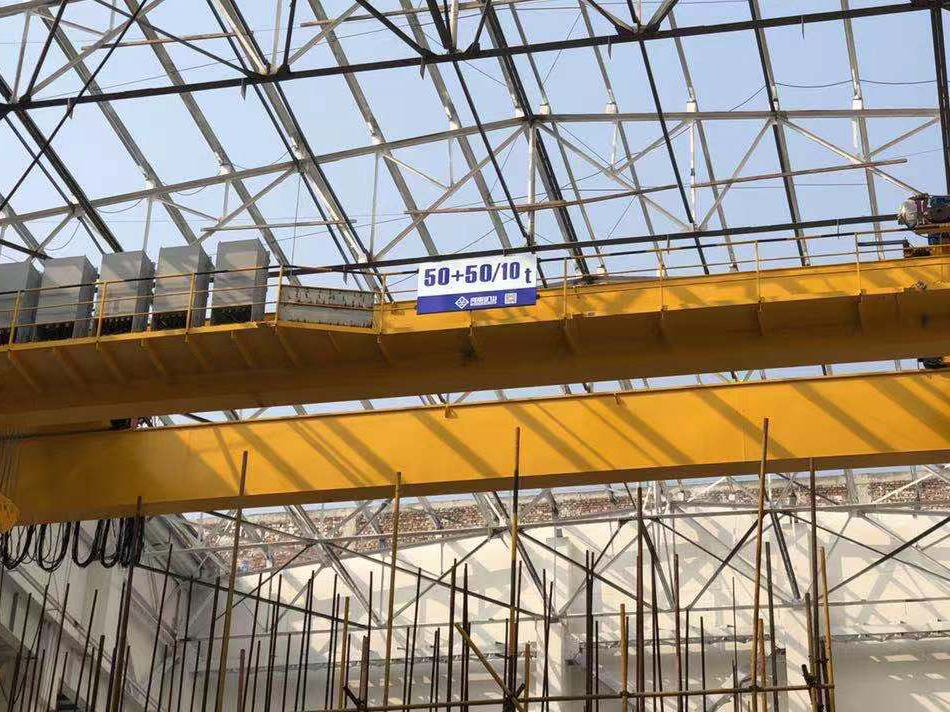
Heavy fabrication, production lifting and factory crane automation.
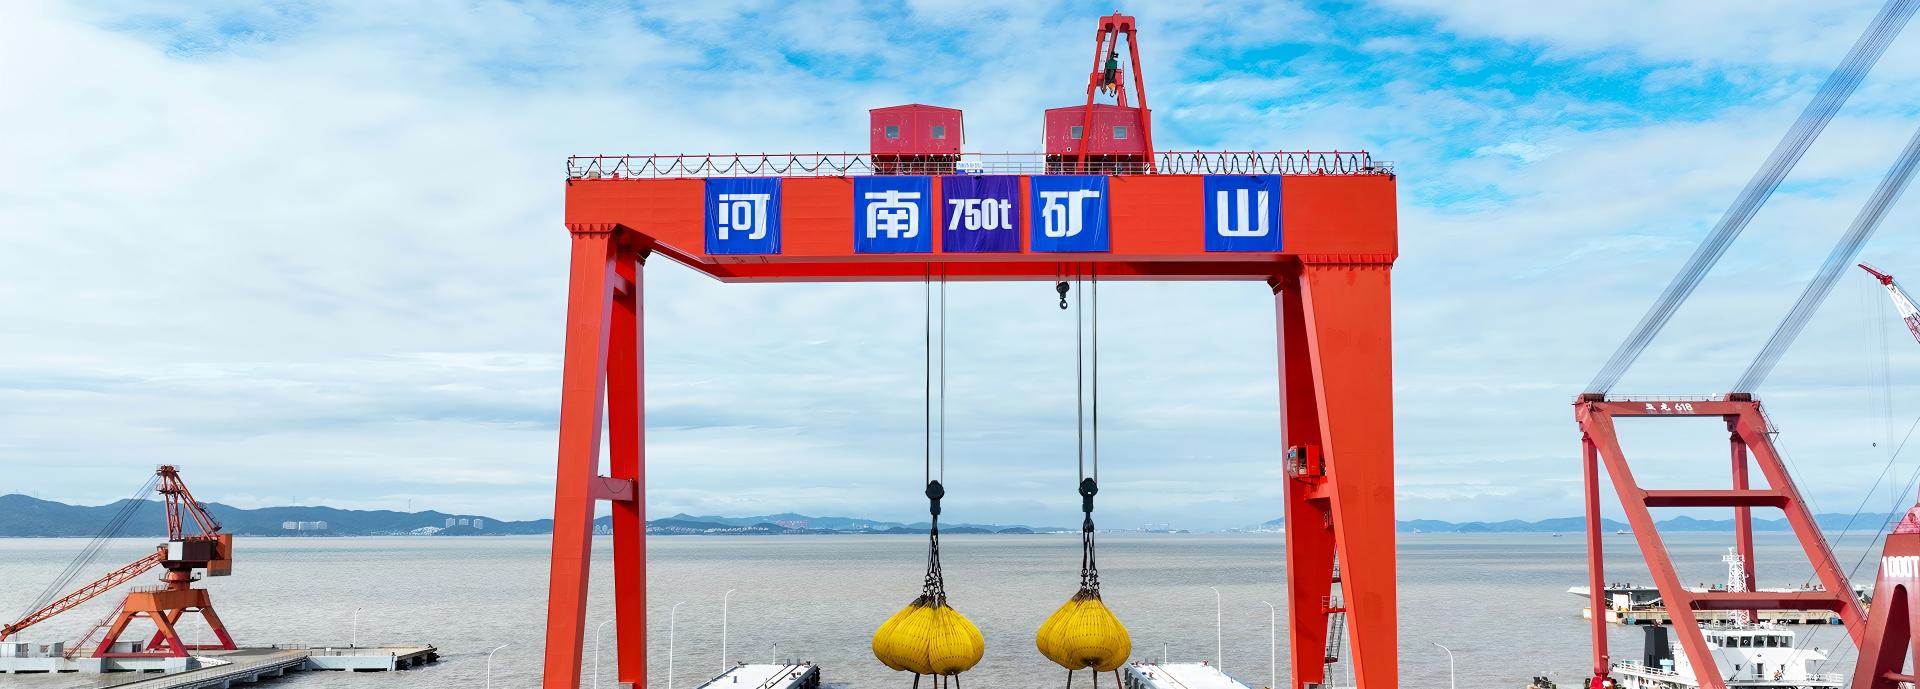
Process lifting for smelters, carbon blocks and anode materials.
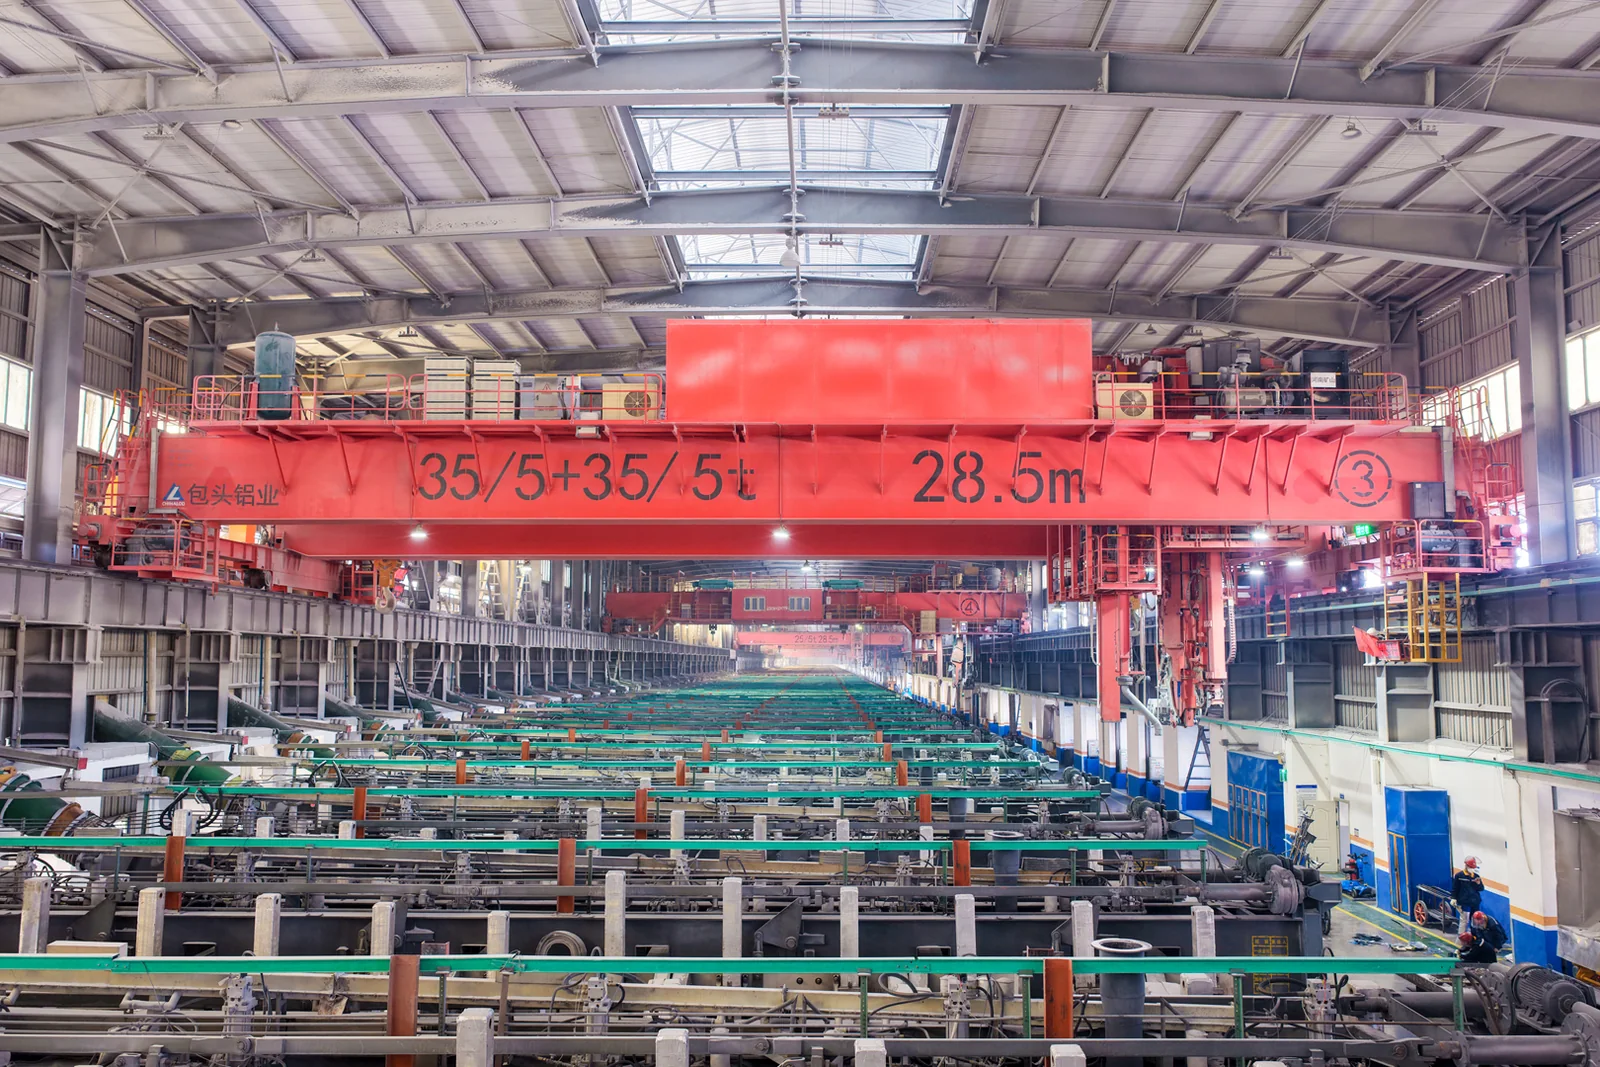
Clean lifting and classified protection for sensitive process areas.
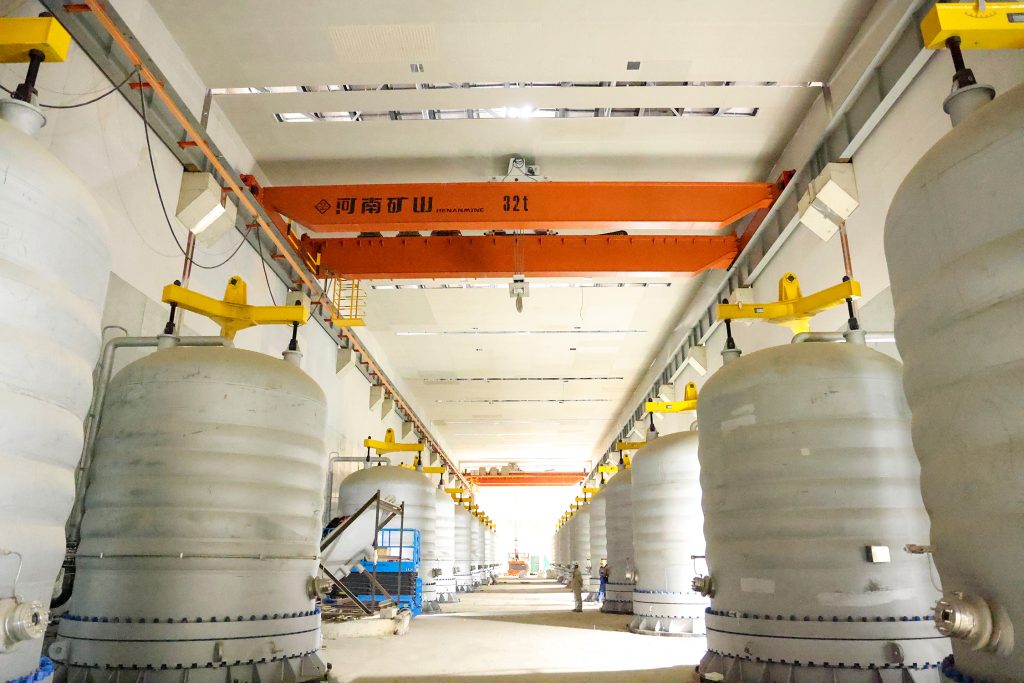
Bridge fabrication, metro construction and ship block assembly.
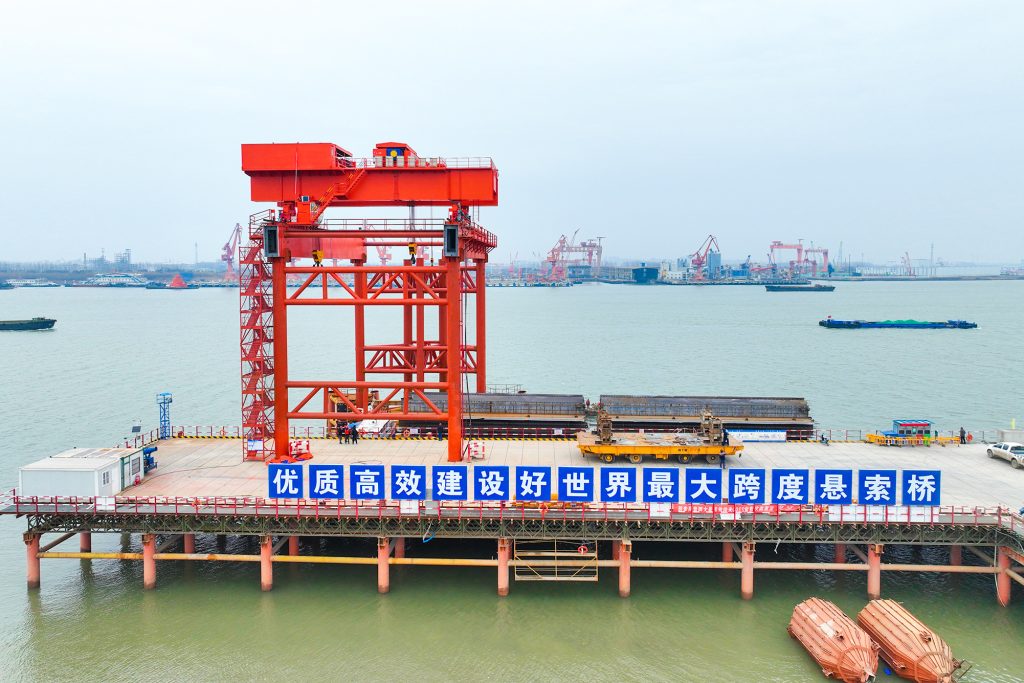
Automated storage and retrieval for plates, cables and bins.
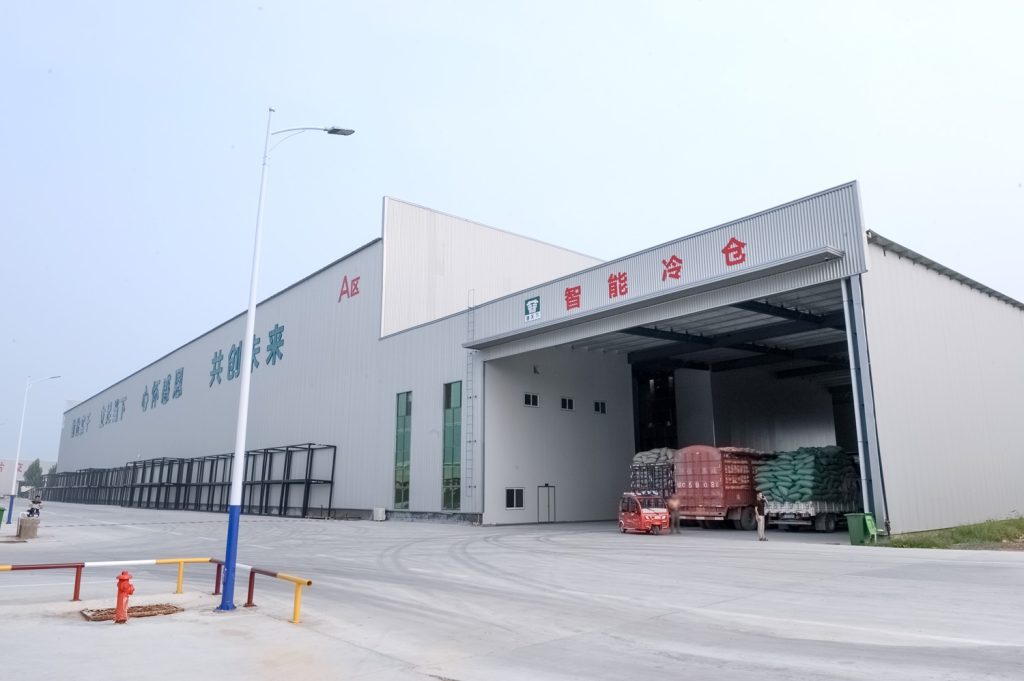
Follow project dispatches, crane engineering and factory acceptance.
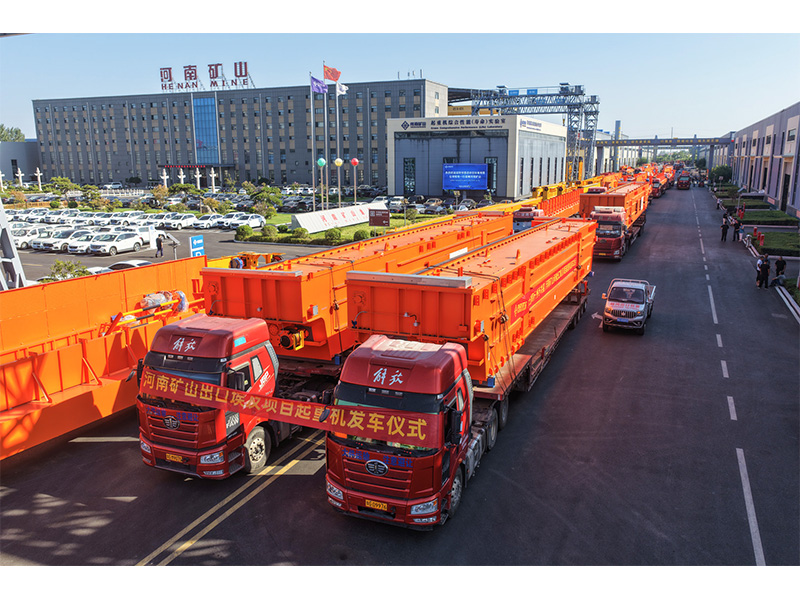
Dispatch, installation and equipment in service
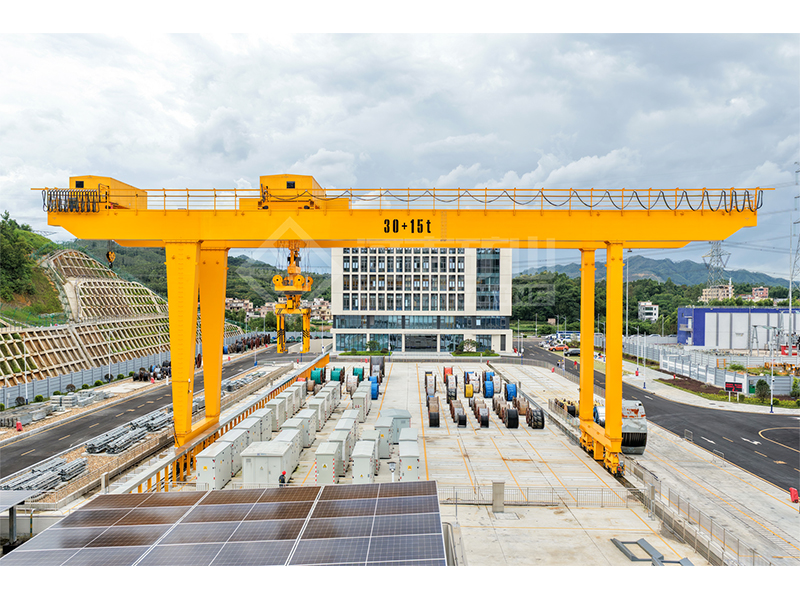
Crane configurations and handling technology
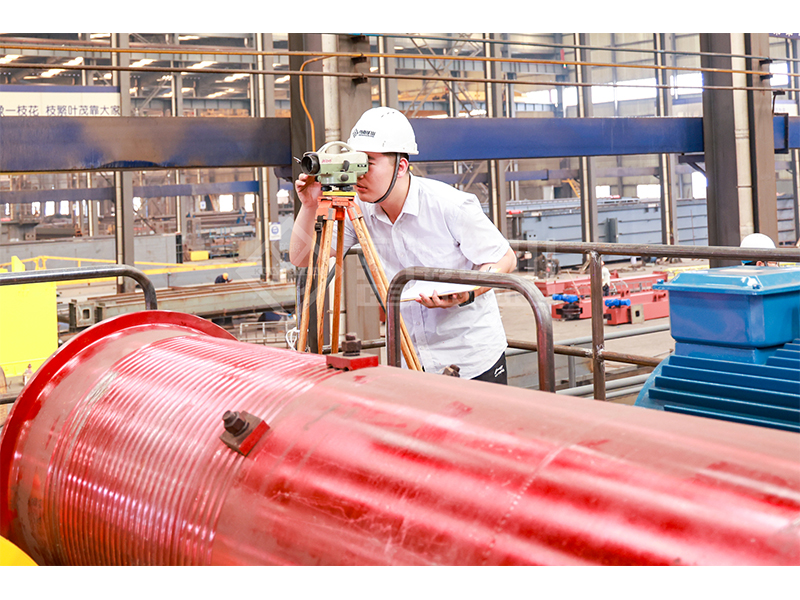
Factory inspections, acceptance and test programmes

Company developments, people and community programmes
Sum linear cumulative damage after the fatigue-model cycles for each stress band have already been established.
Keep each applied count n with the N corresponding to that same stress range and fatigue detail.
Use zero applied cycles for unused bands. Retain a positive N so every ratio remains defined.
Read each n/N contribution and their sum D. Apply the acceptance criteria of the selected fatigue method separately.
100,000 applied cycles with N = 1,000,000 and 200,000 applied cycles with N = 2,000,000; zero applied cycles in bands 3 and 4.
Each populated band contributes 0.1, giving a linear cumulative damage sum D = 0.2 over 300,000 applied cycles.
D is the arithmetic sum of the entered n/N ratios under the linear Miner model.
A larger contribution identifies a band that consumes more of the selected fatigue-model capacity.
This calculation does not establish remaining safe life, load-sequence effects, crack growth or design acceptance.
Using one N for every band even though their stress ranges differ.
D = Σ(n_i/N_i)
D is a modelled damage sum; this tool does not assign a design acceptance or remaining safe life.
Acceptance depends on the selected fatigue design method, factors, stress model and assessed detail. This tool makes no automatic pass decision.
No. Each input n is a cycle count, and each N is the corresponding fatigue-model cycle count for that stress band.